Enabling SCSI-3 SCSI Persistent Reservation to IBM GPFS

Just bought a QNAP device for tests, configured ISCSI which supports various PR modes of ISCSI, but IBM GPFS 5 on RHEL 7 keeps saying that disk does not support Persistent Reservation mode. However this is due to fact, that IBM limits list of devices which they support for PR on GPFS (probably for commercial reasons). However practically the range supported of devices is wider.

So my ISCSI device did support the mode:

# sg_persist -d /dev/sdb -c
  QNAP      iSCSI Storage     4.0
  Peripheral device type: disk
Report capabilities response:
  Compatible Reservation Handling(CRH): 1
  Specify Initiator Ports Capable(SIP_C): 1
  All Target Ports Capable(ATP_C): 1
  Persist Through Power Loss Capable(PTPL_C): 1
  Type Mask Valid(TMV): 1
  Allow Commands: 1
  Persist Through Power Loss Active(PTPL_A): 1
    Support indicated in Type mask:
      Write Exclusive, all registrants: 1
      Exclusive Access, registrants only: 1
      Write Exclusive, registrants only: 1
      Exclusive Access: 1
      Write Exclusive: 1
      Exclusive Access, all registrants: 1

However when I tried to enable the persistent reservation, I got following output:

# mmchconfig usePersistentReserve=yes

Verifying GPFS is stopped on all nodes ...
mmchconfig: Processing disk nsd1
mmchconfig: Device sdb does not support PR_shared reserve policy.
mmchconfig: Unable to set reserve policy PR_shared on disk nsd1 on node xserver1.

However, after digging a little bit into mmchconfig, seems like it is script, and it calls some support libraries to detect, what is supported and what not. Thus by after 30 min of analysis, I did found out that there is list of supported devices into one of the GPFS scripts. Thus lets enable support for our QNAP NAS (note that match in the script is done against first line returned by sg_persist, in our case QNAP* would be fine):

Edit /usr/lpp/mmfs/bin/mmfsfuncs.Linux with following updated (right before HITACHI):

diff mmfsfuncs.Linux.backup mmfsfuncs.Linux

+  # QNAP OK
+  if [[ $searchString = "QNAP"* ]]; then
+      return 0
+  fi
+
 

Now trying out:

# mmchconfig usePersistentReserve=yes

Succeeds!!!! And if checking the drive statuses, my drive happily shows that PR is enabled:

# mmlsnsd -X

 Disk name       NSD volume ID      Device          Devtype  Node name or Class       Remarks
-------------------------------------------------------------------------------------------------------
 nsd1            XXXXXXXXFFFFFFFF   /dev/sdb        generic  xserver1                  server node,pr=yes
 nsd1            XXXXXXXXFFFFFFFF   /dev/sdb        generic  xserver1                  server node,pr=yes
 nsd1            XXXXXXXXFFFFFFFF   /dev/sdb        generic  xserver1                  server node,pr=yes

And the reservation keys are assigned too:

]# /usr/lpp/mmfs/bin/tsprreadkeys sdb
Registration keys for sdb
1. 00006d0000000001
2. 00006d0000000003
3. 00006d0000000002

Thus for sort of development testing, this shall be fine. However, I strongly recommend DO NOT DO THIS for production! Just get some official advice for IBM, on which disk arrays PR mode is supported or ask IBM permission to enable new device.

Kubernates cluster install on Ubuntu 18.04, two nodes

Intro

This tutorial installs Kubernates cluster on two Ubuntu 18.04 servers. The network topology is following (but basically it does not matter where the each VM is located):

Untitled Diagram (1)

1. Install requirements on both Ubuntu machines

On both nodes Ubuntu 18.04 server OS is installed, with SSH enabled only, all other packages are not installed.

Execute commands on both nodes (e.g. kub1 and kub2):

$ sudo apt update
$ sudo apt-get upgrade
$ sudo apt install docker.io
$ sudo systemctl enable docker
$ sudo docker --version

Now install the Kubernates it self. Add deb repository keys and repo it self on both nodes.

$ curl -s https://packages.cloud.google.com/apt/doc/apt-key.gpg | sudo apt-key add
$ sudo apt-add-repository "deb http://apt.kubernetes.io/ kubernetes-xenial main"

Now install kubernates:

$ sudo apt install kubeadm

Checking Kubeadm version:

$ kubeadm version

Before continue, Kubernates requires to disable the swap:

$ sudo swapoff -a

To disable swap permanently, in /etc/fstab, edit /etc/fstab and comment off the swap line, for example:

UUID=44cfd840-bd5b-4275-a231-59f798aaa81d / ext4 defaults 0 0
#/swap.img none swap sw 0 0


Set host names on corresponding machines:

On kub1:

$ sudo hostnamectl set-hostname kub1

On kub2:

$ sudo hostnamectl set-hostname kub2

Also ensure that both hosts can be resolved, check the /etc/hosts:

On kub1 should have something like:

127.0.1.1 kub1
192.168.0.96 kub2

On kub2 should have:

127.0.1.1 kub2
192.168.0.95 kub1

2. Installing master on first server (e.g. kub1):

Init the cluster with:

$ sudo kubeadm init --pod-network-cidr=10.222.0.0/16
...

Then you can join any number of worker nodes by running the following on each as root:

kubeadm join 192.168.0.95:6443 --token nffusj.s84179w9u5o2qtwa \
--discovery-token-ca-cert-hash sha256:a4cf37379ded0b6a9b257e8051234569ac321f3c2cef9754262c294e2350fb71

Afterwards for admin user (or any body else who plan to use administer the Kubernates cluster), execute following commands:

$ mkdir -p $HOME/.kube
$ sudo cp -i /etc/kubernetes/admin.conf $HOME/.kube/config
$ sudo chown $(id -u):$(id -g) $HOME/.kube/config

To check the status of the master node, execute:

$ kubectl get nodes

3. Installing second worker node (e.g. kub2):

To join the worker to the cluster, execute the command which was returned from “kubeadm init …” output. In author’s case it was:

$ sudo kubeadm join 192.168.0.95:6443 --token nffusj.s84179w9u5o2qtwa \
--discovery-token-ca-cert-hash sha256:a4cf37379ded0b6a9b257e8051234569ac321f3c2cef9754262c294e2350fb71


4. Back on master machine (kub1)

Once all done, no master node check again the nodes and output shall look similar to this:

$ kubectl get nodes
NAME   STATUS   ROLES    AGE   VERSION
kub1   Ready    master   12h   v1.16.3
kub2   Ready    worker   12h   v1.16.3


5. Trouble shooting

This chapter lists some common problems which author have found during the Kubernates install.

5.1 If after the booting kubadm returns you “The connection to the server 192.168.0.96:6443 was refused – did you specify the right host or port?”

$ kubectl get pods --all-namespaces
The connection to the server 192.168.0.96:6443 was refused - did you specify the right host or port?

Ensure that swap was disabled in /etc/fstab (see above). Temporary do you may do again:

$ sudo swapoff -a
$ sudo service kubelet start

5.2 If you have messed something and want to do all process again…:

You may execute on both nodes:

$ sudo kubeadm reset

afterwards reboot the servers. After reboot you may continue from step 2.

5.3 If node status is “NotReady” (on kub1 – master)

If command “kubectl get nodes” returns NotReady status:

$ kubectl get nodes
NAME STATUS ROLES AGE VERSION
kub1 NotReady master 12h v1.16.3
kub2 NotReady worker 12h v1.16.3

Then use command “describe” to check the state:

$ kubectl describe nodes

In author’s case, from describe it could be seen that:

...
Conditions:
Type Status LastHeartbeatTime LastTransitionTime Reason Message
---- ------ ----------------- ------------------ ------ -------
...
Ready False Mon, 09 Dec 2019 21:33:57 +0000 Mon, 09 Dec 2019 21:26:49 +0000 KubeletNotReady runtime network not ready: NetworkReady=false reason:NetworkPluginNotReady message:docker: network plugin is not ready: cni config uninitialized
...

So there is problem with network.

For this particular case, workaround is to edit /var/lib/kubelet/kubeadm-flags.env file and remove “cni” network plugin, so file after edit (removed –network-plugin=cni):

sudo cat $/var/lib/kubelet/kubeadm-flags.env

#KUBELET_KUBEADM_ARGS="--cgroup-driver=cgroupfs --network-plugin=cni --pod-infra-container-image=k8s.gcr.io/pause:3.1 --resolv-conf=/run/systemd/resolve/resolv.conf"
KUBELET_KUBEADM_ARGS="--cgroup-driver=cgroupfs --pod-infra-container-image=k8s.gcr.io/pause:3.1 --resolv-conf=/run/systemd/resolve/resolv.conf"

Afterwards reboot the host. If fixed, the status shall be:

$ kubectl get nodes
NAME STATUS ROLES AGE VERSION
kub1 Ready master 12h v1.16.3
kub2 Ready worker 12h v1.16.3


Stack allocation vs heap allocation – performance benchmark

Intro

It has always been debate about heap allocation or stack allocation performance in C/C++ code (or in other programming language). We all know that stack allocation means that assembly just needs to increment stack pointer and that’s it. How ever in case of heap, there is lot more going on. The memory allocator needs to ask kernel for some free page, needs to partition the page properly, with time fragmentation may occur, etc. Thus with one word to say, lot of work. But there are very few if any benchmarks available on the web for real comparison about the results with one or another technique and how really it affects that execution speed.

Now time is come for some real benchmark for stack allocation versus heap allocation. The test scenario is following:

  • In the loop allocate memory blocks with 10 different chunks with different total sizes.
  • Fill the chunks with some data.
  • Measure the data and provide some output (to avoid compiler optimizations for doing nothing).
  • Free memory.

Following tests are performed:

  • Using gcc -O1 optimizations, heap vs stack with out data init.
  • Using gcc -O1 optimizations, heap vs stack with data init.
  • Using gcc -O2 optimizations, heap vs stack with out data init.
  • Using gcc -O2 optimizations, heap vs stack with data init.

In test cases with out memory initialization, the memory pointer addresses are summed and printed on stderr, so that compiler would optimize the allocations because of no further usage.

The data initialization is done by doing memcpy. The typical memory block usage usually is not byte access, but some more bulky, like mem copy, integer, long, etc i.e. word size access to memory. Thus the test case with initialization uses pre-initialized memory block with random data which is copied to target buffer. After the copy every 10th byte is read.

The testing package uses Enduro/X high performance middleware standard library for results plotting and time measurements. The actual code used for testing can be found here. The code is pure C. The stack based allocation with different sizes is done by using C99 variable length array feature.

Test results

Particular test cases was executed on Intel(R) Core(TM) i7-6600U CPU, Linux 64 bit, 4.15.0-50-generic, Spectre and Meltdown patches disabled. For your hardware setup, you might want to adjust LOOPS variable in build.sh before running, due to different machine speed. As too fast machine will give inconsistent measurements. To slow machine might give “infinite” wait time for results.

Heap vs Stack, -O1, no data init

noinit1

Heap VS Stack allocation benchmark, milliseconds per 10 million allocations of mixed 10 block sizes

Heap vs Stack, -O1, with data init

filled1

1M memory allocations with 10 differently sized chunks 

Heap vs Stack, -O2, no data init

noinit2

10M allocations with 10 mixed memory blocks 

Heap vs Stack, -O2, with data init

filled2

1M allocations with 10 mixed blocks

Conclusions

In conclusions we see that pure with out data init, stack allocation is much faster. Difference is about 4 seconds on 10M loops over 10 allocation attempts. So if checking on single pair of malloc+free, this will be about 0.4 seconds. But needs to take into account that 10 millions, is very very big number to process.

To continue we see that with -O2 filled data initialization shows much smaller gap between stack and heap allocation, due to fact that CPU is much more busy with data processing than allocation procedures. But any way on 1 million loops with 10 allocation+init+free attempts, we see that difference is about 8% at 60KB total processing size. Which also also not a big show stopper.

Thus to conclude, there is difference between stack and heap allocation strategies, but in real processing life, the affect on processing speed is low. In case if there is choice in doing stack allocation and afterwards doing copy of data to other data block due to stack allocation life cycle boundaries, much more effective would be to use heap allocation and pass the pointer to other function program blocks instead of copy.

Memory leak detect in uncertain cases – advanced techniques by JNI Example

Just wanted to share my experience with endurox-java development with is binding for Enduro/X Real Time Microservices middleware. During the long running test cases, it is been found that processes basically are leaking the memory. But Valgrind does not report that memory is leaked. Thus next step if you are sure that there is leak, you may use “–show-reachable=yes” parameter, to track down similar places/sizes where possibly leaked (decided by you) memory could be allocated.

In this case author found that it is somewhere in libjvm.so. This may be a call from JNI back to Java VM, as “jmap -histo 3928” did not show any object leak. So what have been seen is that some object of 312 bytes somewhere periodically is allocated (the number of allocs are similar to IPC call count):

==3928== 312 bytes in 1 blocks are possibly lost in loss record 15,259 of 15,611
==3928== at 0x4C2DB8F: malloc (in /usr/lib/valgrind/vgpreload_memcheck-amd64-linux.so)
==3928== by 0x58F4FEC: ??? (in /usr/lib/jvm/java-8-openjdk-amd64/jre/lib/amd64/server/libjvm.so)
==3928== by 0x52F9538: ??? (in /usr/lib/jvm/java-8-openjdk-amd64/jre/lib/amd64/server/libjvm.so)
==3928== by 0x52F95F4: ??? (in /usr/lib/jvm/java-8-openjdk-amd64/jre/lib/amd64/server/libjvm.so)
==3928== by 0x56E5FA9: ??? (in /usr/lib/jvm/java-8-openjdk-amd64/jre/lib/amd64/server/libjvm.so)
==3928== by 0x56A2CE6: ??? (in /usr/lib/jvm/java-8-openjdk-amd64/jre/lib/amd64/server/libjvm.so)
==3928== by 0x56A5685: ??? (in /usr/lib/jvm/java-8-openjdk-amd64/jre/lib/amd64/server/libjvm.so)
==3928== by 0x566435F: ??? (in /usr/lib/jvm/java-8-openjdk-amd64/jre/lib/amd64/server/libjvm.so)
==3928== by 0x599D38E: ??? (in /usr/lib/jvm/java-8-openjdk-amd64/jre/lib/amd64/server/libjvm.so)
==3928== by 0x8979584: ???
==3928== by 0x783D389C7: ???
==3928== by 0x8A21FA7: ???

Thus to trace further, as the Enduro/X Libaries are using debug logging at certain steps, it would be helpful print some debug message when memory is allocated, thus by context is process logs, it could be possible to detect region in code where the leaking occurs. Thanks to GNU C Library, it is possible to install malloc/realloc/free hooks to do so. Thus author does following – updates java loader – Enduro/X Java Linker (a compiler for building java apps as stand alone binaries which basically boots a C code which loads a Java class from byte array and starts to execute it) to init a a hook for a malloc:

/* save the original pointer... */
__thread void * old_malloc_hook;

static void *
my_malloc_hook (size_t size, const void *caller)
{
void *result;
nstd_tls_t *tls;
/* Restore all old hooks */
__malloc_hook = old_malloc_hook;

/* Call recursively */
result = malloc (size);

/* Save underlying hooks */
old_malloc_hook = __malloc_hook;
/* NOTE!!!! THIS MUST NOT use gettimeofday() as it will deadlock! */
NDRX_LOG(log_error, "malloc (%d) returns %p", (int)size, result);

/* Restore our own hooks */
__malloc_hook = my_malloc_hook;

return result;
}

static void
my_init (void)
{
old_malloc_hook = __malloc_hook;
__malloc_hook = my_malloc_hook;
}

And thus now in logs got something more pointing out… in logs:

N:NDRX:5:d5d3db3a: 2961:7f14cece9840:001:00000000:000000000:er_translate:Buffer.c:0332:Allocating [org/endurox/TypedUbf] class
N:NDRX:5:d5d3db3a: 2961:7f14cece9840:001:00000000:000000000:er_translate:Buffer.c:0352:About to NewObject(org/endurox/TypedUbf)
N:NDRX:2:d5d3db3a: 2961:7f14cece9840:001:00000000:000000000:_malloc_hook:ds/exj.c:0523:malloc (312) returns 0x100cb40
N:NDRX:5:d5d3db3a: 2961:7f14cece9840:001:00000000:000000000:er_translate:Buffer.c:0363:NewObject() done

WHOLLA, seems like we do some malloc before creating a new object of 312 bytes… So what is it? if we check further the logs, we see that 312 bytes are allocated at intervals where java env object calls are made from C. Thus something strange happens… And the thing is.. The Enduro/X Java service call dispatcher is fully started from C side, and code like this one (fixed already):

...
NDRX_LOG(log_debug, "Allocating [%s] class", clazz);
    
bclz = (*env)->FindClass(env, clazz);
NDRX_LOG(log_debug, "About to NewObject(%s)", clazz);
    
ret = (*env)->NewObject(env, bclz, mid, ctx_obj, (jboolean)finalize, 
            (jlong)data, len);

NDRX_LOG(log_debug, "NewObject() done");

/* line added after leak found...: */
(*env)->DeleteLocalRef( env, bclz);

...


Still generates local references for “class definitions” to C and thus they must be made free, by:

/* line added after leak found...: */
(*env)->DeleteLocalRef( env, bclz);

Thus to conclude, the valgrind still accessible printing feature might hint you the size of leaked objects. The Glib C __malloc_hook feature, gives further options to understand in log sequence where problem occurs, the with some brainstorming it is possible to more closely understand where the leaks occur.

Selinux problems

Enabled Selinux on can cause different kind of problems in Linuxes, for example during the one working day I found that:

  • Samba4 gave me NT_STATUS_ACCESS_DENIED when user tried to read share (i.e. cifs client gave permission denied when listing files in directory)
  • bacula-fd backup agent also was unable to working with partitions and root resources:
11-Sep 17:51 server2-dir JobId 920: Start Backup JobId 920, Job=DellsrvVMBackup.2018-09-11_17.51.56_09
11-Sep 17:51 server2-dir JobId 920: Using Device "FileStorage" to write.
11-Sep 17:51 server2-fd JobId 920: shell command: run ClientRunBeforeJob "/opt/backup/mk_snapshoot.sh"
11-Sep 17:51 server2-fd JobId 920: ClientRunBeforeJob: root
11-Sep 17:51 server2-fd JobId 920: ClientRunBeforeJob: /opt/backup/mk_snapshoot.sh: line 10: //data/snapshoot/sysinfo.txt: Permission denied
11-Sep 17:51 server2-fd JobId 920: ClientRunBeforeJob: uid=0(root) gid=0(root) groups=0(root) context=system_u:system_r:bacula_t:s0
11-Sep 17:51 server2-fd JobId 920: ClientRunBeforeJob: suspending machine [strategy]
11-Sep 17:51 server2-fd JobId 920: ClientRunBeforeJob: /opt/backup/mk_snapshoot.sh: line 39: /usr/bin/virsh: Permission denied
11-Sep 17:51 server2-fd JobId 920: ClientRunBeforeJob: saving state for [strategy], Logical Volume [server1]
11-Sep 17:51 server2-fd JobId 920: ClientRunBeforeJob: /opt/backup/mk_snapshoot.sh: line 42: /usr/bin/virsh: Permission denied
11-Sep 17:51 server2-fd JobId 920: Error: Runscript: ClientRunBeforeJob returned non-zero status=1. ERR=Child exited

Thus to get rid with these problems, I just disabled the Selinux on these servers and system started automagically to work. For Centos 7, do following from root user:

To check selinux status:

# sestatus

To disable selinux during the current OS run:

# setenforce 0

The disable selinux permanently, edit /etc/selinux/config and update to:

# This file controls the state of SELinux on the system.
# SELINUX= can take one of these three values:
# enforcing - SELinux security policy is enforced.
# permissive - SELinux prints warnings instead of enforcing.
# disabled - No SELinux policy is loaded.
# UPDATE: from "enforcing" to disabled
SELINUX=disabled
# SELINUXTYPE= can take one of these two values:
# targeted - Targeted processes are protected,
# minimum - Modification of targeted policy. Only selected processes are protected.
# mls - Multi Level Security protection.
SELINUXTYPE=targeted

A4 Tech mouse wheel speed fix on Linux

Seems like some A4 Tech mouses like T70 have by default slow wheel speed for scrolling. Thus fix is needed. This can be done by “imwheel” utility. Lets fix this on Linux Mint Mate:

$ sudo apt-get install imwheel

Once it is installed, lets create a configuration file in your home directory (i.e. you may just edit the “.imwheelrc” file in your home directory (add content between starting and ending lines), or just execute the script:

$ cat << EOF > ~/.imwheelrc
 ".*"
 None, Up, Button4, 2
 None, Down, Button5, 2
 Control_L, Up, Control_L|Button4
 Control_L, Down, Control_L|Button5
 Shift_L, Up, Shift_L|Button4
 Shift_L, Down, Shift_L|Button5

EOF

After this done, the “imwheel” needs to be added to startup, we can do this in session Application startup list, just add entry there:

Workspace 1_151

Startup apps menu

Workspace 1_152.png

Startup entry

After reboot, the scroll shall become as sensitive as for usual mouses.


Kafka vs RabbitMQ vs Enduro/X vs ActiveMQ on Go – performance benchmark of the year 2018!

This blog explores to compare with equal tests large quantity of the modern middlewares available on the market. The test compares most trending middlewares which are:

The testing is based on Enduro/X middleware benchmark suite. Which basically performs two types of tests between to processes located on local machine. The tests are following:

  1. Two way RPC (client call server and server responds back)
  2. One way – client process connects to server and streams all the data to Server

The testing code is written for Go language and is based on Enduro/X Bechmark Suite.

Test platform

Both benchmarks ar performed on following system:

  • Linux Mint 18.3
  • Linux 4.10.0-38-generic #42~16.04.1-Ubuntu SMP Tue Oct 10 16:32:20 UTC 2017 x86_64 x86_64 x86_64 GNU/Linux
  • CPU: Intel(R) Core(TM) i5-4300U CPU @ 1.90GHz
  • RAM: 12GB

Java version 1.8:

$ java -version
openjdk version "1.8.0_171"
OpenJDK Runtime Environment (build 1.8.0_171-8u171-b11-0ubuntu0.16.04.1-b11)
OpenJDK 64-Bit Server VM (build 25.171-b11, mixed mode)

Test results

This section lists test results got from the system testing.

RPC Style

vs

RPC style calls – Enduro/X vs RabbitMQ vs Kafka vs ActiveMQ

From the results we see that Enduro/X performs very well with RPC style calls. All other middlewares keeps almost the same results. Seems like ActiveMQ gets little better with bigger message sizes.

One way (classical publish/subscribe)

vs1w.png

One way calls: RPC style calls – Enduro/X vs RabbitMQ vs Kafka vs ActiveMQ

With one way calls. We get in the front the Apache Kafka. Then Enduro/X follows. all other competitors seems to run at the same level. Also we see that with bigger message sizes, at some points ApacheMQ gets in the front.

CPU/Memory Usage during testing

This section lists CPU usage author monitored on his testing machine.

Kafka

kfk_ok

CPU Usage Kafka RPC

kfk1w

CPU Usage Kafka Oneway

RabbitMQ

rbt

CPU Usage RabbitMQ RPC

1wrbt

CPU Usage RabbitMQ Oneway

Enduro/X

ex

CPU usage Enduro/X RPC

ex1w

CPU usage Enduro/X Oneway

ActiveMQ

amq

CPU Usage ActiveMQ RPC

1wamq

CPU Usage ActiveMQ Oneway

System stability

Author have faced following issues during the testing:

Kafka notes

For Kafka, Author faced “Queue full” error during the one way publish to topic test. The quick-and-dirty fix was to restart client call during the facing this error.

ActiveMQ notes

During the ActiveMQ testing with Go (uses STOMP protocol), author got several times, “connection closed” during the client send operations, for example:

$ ./run1w.sh 
~/projects/endurox-benchmark-suite/tests/activemq ~/projects/endurox-benchmark-suite/tests/activemq
Starting server process...
panic: send on closed channel
goroutine 1 [running]:
github.com/go-stomp/stomp.(*Conn).Send(0xc42009e3f0, 0x563f5d, 0xd, 0x566378, 0x18, 0xc4200b4a80, 0x940, 0x940, 0xc42004dbd0, 0x1, ...) /home/mvitolin/projects/endurox-benchmark-suite/src/github.com/go-stomp/stomp/conn.go:437 +0x299 main.runbench.func1(0xc42000e038, 0x14c0000000388, 0xc4200b4a80, 0x940, 0x940, 0x1, 0x0, 0x0, 0x0, 0x0)
 /home/<hidden>/projects/endurox-benchmark-suite/src/amqclt/amqclt.go:51 +0x17f exbench.Ndrx_bench_clmain(0xc42000e038, 0x1, 0xc42004dec8, 0x2d)
 /home/<hidden>/projects/endurox-benchmark-suite/src/exbench/testutil.go:248 +0x345 main.runbench(0x0)
 /home/<hidden>/projects/endurox-benchmark-suite/src/amqclt/amqclt.go:38 +0x19f main.main()
 /home/<hidden>/projects/endurox-benchmark-suite/src/amqclt/amqclt.go:108 +0xd7 amqclt -num 400000 -oneway failed
Test exiting with: 2


Thus the code was fixed to re-connect in case of client errors.


Conclusions

During the testing the results shows that Enduro/X shows goods results with RPC style calls. For Oneway testing (publish only), Apache Kafka was the best. But downside for Kafka is that calls were not blocked, thus “dirty” solution was to restart the sending message to the queue while the Enduro/X no “dirty fixes” are needed, as when the queue is full, the process blocks and waits for free space. Then after all the ActiveMQ with Go STOMP client was also showing good results when message size increased. But the downside with STOMP client was that, during the testing, the client got disconnected for some reason. RabbitMQ also seems to be stable platform and no special fixes were needed to execute the test cases (except that channel send must be used to get “blocked” style calls). RabbitMQ showed quite good stable results.

Enduro/X vs RabbitMQ review and benchmark

This article analyses two popular middle-ware platforms. One is High Performance middleware named Enduro/X and the other is RabbitMQ message queue. This blog will analyse them both from different technical aspects, like ease of programming, features and performance. For performance analysis sample programs will be written in both environments which will perform simple RPC (service calls) with request and reply.
The Rabbit MQ RPC code will be based on: example here.

RabbitMQ will be installed to Linux Mint 18.3/Ubuntu 16.04 according to this manual.

Test scenario

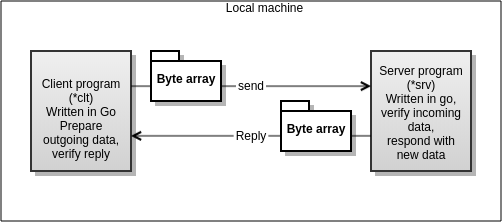
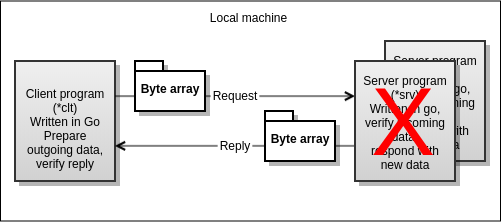
Test scenario will transport byte array of data to RPC server, the server process will transform the buffer in certain way (increment each byte by 1) and respond back to caller. The caller will measure response times. The code for both test cases will be the same. Testing will also include fault operations. For example what will happen to IPC traffic between business logic server and client in case if main admin processes of the middleware crashes. This would be critical point for fault tolerant processing. As for systems running in 24x7x365 requires ultra high stability. The IPC/RPC is performed in terms of local host. Thus showing the strength of the “open systems” programming model, where application is built  from modular executables, building the client/server architecture based solutions.

exsuite.png

Conceptual test flow chart

The code

Common library will be built for buffer formatting, buffer verification and time measurements (and for plotting the results to results file). Language for testing is chosen Google Go lang. Reason for this, is for simplicity and better code readability. For testing Enduro/X Benchmark Suite is used. For Enduro/X test standard ATMI Client and Server is built which is two binaries. The Server is booted by Enduro/X (ndrxd) server and client process is started by process.

Startup scripts for the benchmarks can be found in “tests” directory, where

  • endurox/run.sh contains the benchmark start script for Enduro/X
  • rabbitmq/run.sh contains the benchmark script for RabbitMQ middleware

For RabbitMQ Go RabbitMQ Client Library is used.
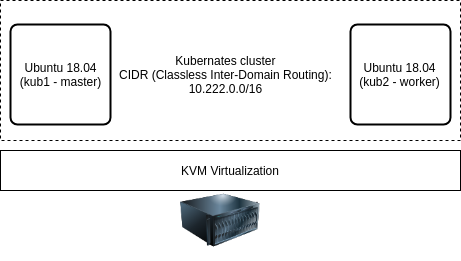
Test system

Both benchmarks ar performed on following system:

  • Linux Mint 18.3
  • Linux 4.10.0-38-generic #42~16.04.1-Ubuntu SMP Tue Oct 10 16:32:20 UTC 2017 x86_64 x86_64 x86_64 GNU/Linux
  • CPU: Intel(R) Core(TM) i5-4300U CPU @ 1.90GHz
  • RAM: 12GB

Benchmark results

Both benchmarks are started with 40000 loops per message size, and then the loops are divided loop step with is 1..128. The message size is made as loop * 32 bytes, thus the final size is 4 KB. The special case is tested with first message, it is tested as single byte transfer.

vs

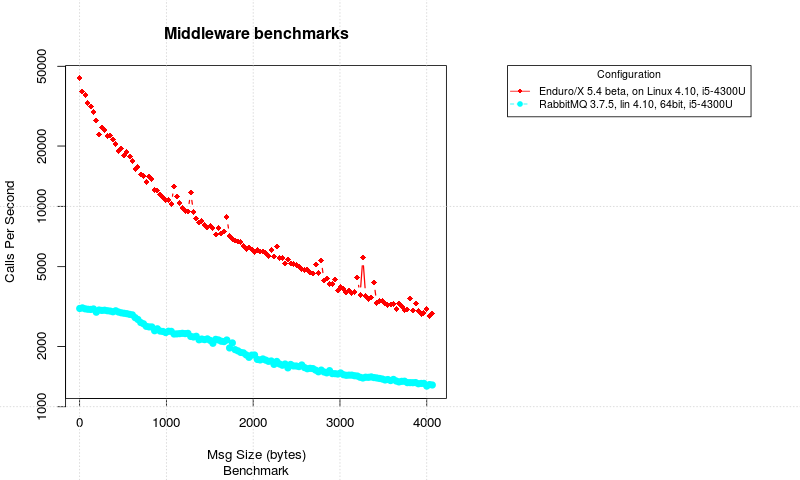
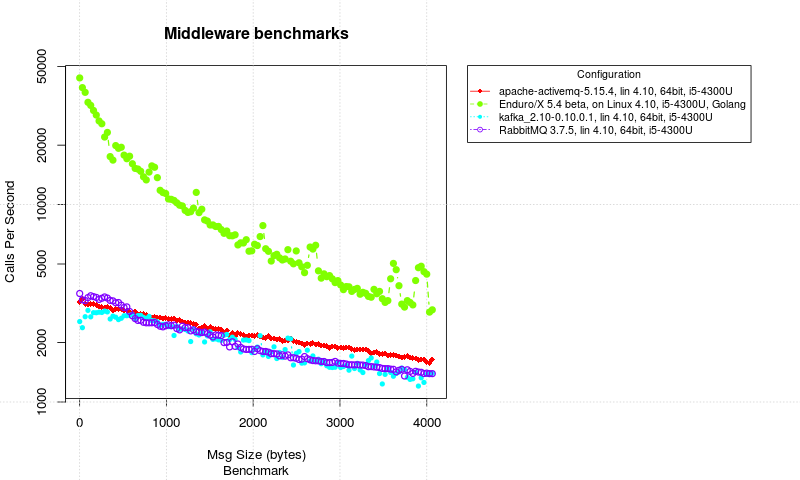
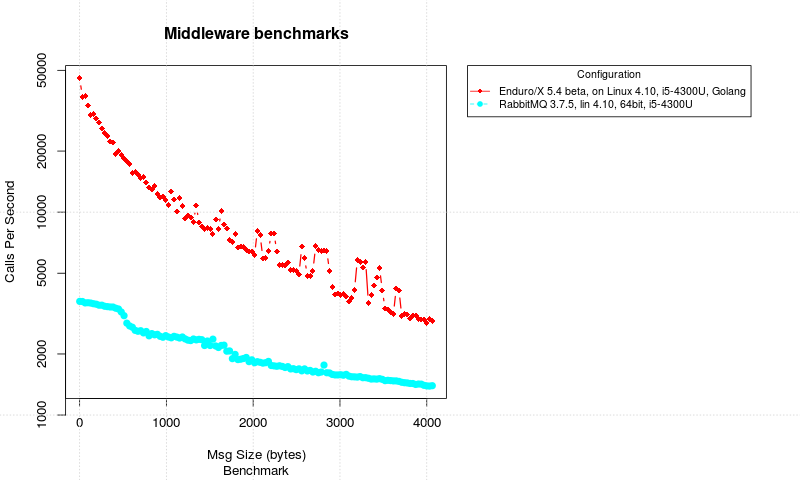
Enduro/X VS RabbitMQ RPC Messaging between Client/Server processes

Also note that Y axis of the picture is logarithmic, to give better visibility of the both system performance.

From the results it could be seen that Enduro/X Middleware is heavy ahead of the RabbitMQ. It start off with with ~ 40’000 calls per second, while only at 2.5KB it drops  bellow the 5000 calls per second. While the RabbitMQ starts off with 3000 calls per second and drops till 1300 calls per second. Mean Enduro/X at 4KB is around the 2800 calls per second.

Thus from this benchmark we could see that Enduro/X is several times faster that RabbitMQ used with Go language.

CPU Usage

To better understand what is happening in the system during the tests (how much resources are utilized), lets look at the Unix “top” utility and lets see what does it shows.
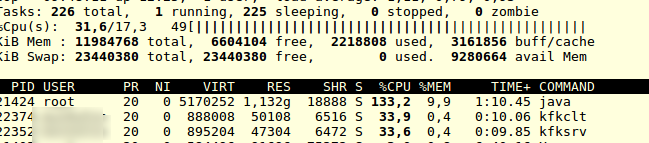
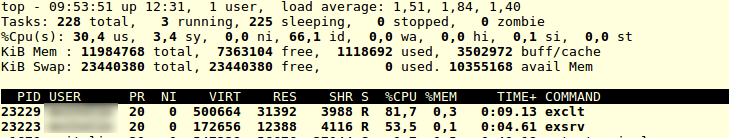
RabbitMQ CPU Usage

Selection_137

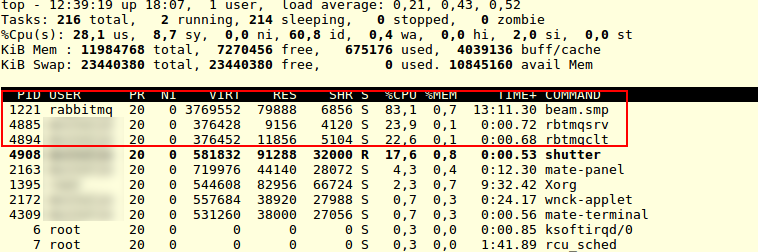
CPU Usage during RabbitMQ Testing

What the TOP shows up is that our binaries like “rbtmqsrv” ad “rbtmqclt” ar both working, but it seems that we have a “man in the middle” which is RabbitMQ by it self. Showing high numbers of CPU usage of process named “beam.smp” from rabbitmq user. Thus the total CPU usage is about 128%. The lower results of the RabbitMQ probably are given by the architecture it self – RabbitMQ uses sockets for IPC. And there is no direct IPC between two processes, but we have a “beam.smp” in the middle. To the data transport has to be done between client -> rabbitmq server -> server and vice versa. Thus it gets additional transport step.
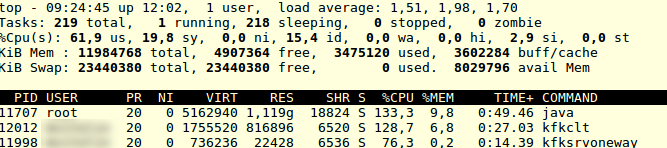
Enduro/X CPU Usage

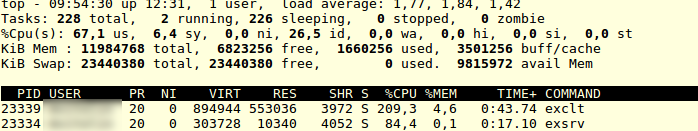
Lets see how Enduro/X acted during the testing (note that screenshot was taken when the test was somewhere in the middle  about 1-2 KB message size.)

Selection_138.png

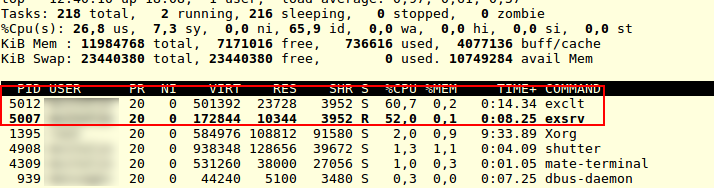
Enduro/X CPU Usage during the test

was with lower message size “exclt” was even taking about 120% CPU. This is probably related with fact that at lower message sizes, the kernel IPC takes less role than local Golang processing.

Thus at average message size about 1-2 KB, the total processing takes about 100 %. This is logical, because half work is done in one process (client) and other half is done in server side, while to other side is sleeping (waiting for response). Client process has some more work to do, as it prepare the original request buffer.

High Availability tests – main app server

For mission critical systems all thinks might happen, for example, some daemon process might die with some process bug, out of the disk space, accidental kill (less likely), etc. in this tests we will see what will happen to our traffic when say application server “main” process will die. For Enduro/X it is “ndrxd” which boots up all the processes and manages their lifetime. For RabbitMQm, from benchmark tests authors sees that significant role takes the “beam.smp” process, thus lets try to kill it during the IPC testing.

Enduro/X HA

After killing the “ndrxd” process:

$ ps -ef | grep ndrxd
<hidden> 5206 1 0 12:40 pts/1 00:00:00 ndrxd -k 0myWI5nu
<hidden> 8123 4314 0 13:03 pts/0 00:00:00 grep --color=auto ndrxd
$ kill -9 5206

We see that program continues with out any problem:

$ top

KiB Mem : 11984768 total, 5765948 free, 1986776 used, 4232044 buff/cache
KiB Swap: 23440380 total, 23440380 free, 0 used. 9367756 avail Mem

PID USER PR NI VIRT RES SHR S %CPU %MEM TIME+ COMMAND 
 8096 <hidden> 20 0 575716 31352 3964 S 65,1 0,3 1:48.89 exclt 
 5208 <hidden> 20 0 238380 10244 3848 R 50,5 0,1 2:14.30 exsrv
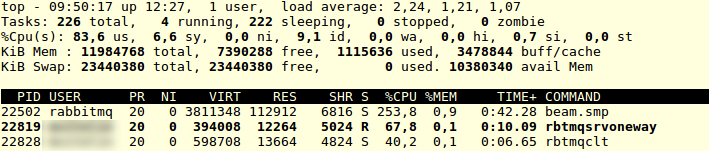
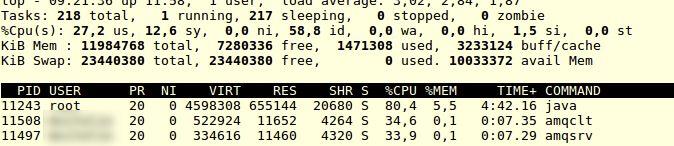
RabbitMQ HA

Now lets try with RabbitMQ. Test started situation:

$ top

top - 13:06:12 up 18:34, 1 user, load average: 0,96, 0,83, 0,64
Tasks: 227 total, 1 running, 226 sleeping, 0 stopped, 0 zombie
%Cpu(s): 25,6 us, 8,5 sy, 0,0 ni, 63,7 id, 0,0 wa, 0,0 hi, 2,1 si, 0,0 st
KiB Mem : 11984768 total, 5787076 free, 1966980 used, 4230712 buff/cache
KiB Swap: 23440380 total, 23440380 free, 0 used. 9388964 avail Mem

PID USER PR NI VIRT RES SHR S %CPU %MEM TIME+ COMMAND 
 1221 rabbitmq 20 0 3769552 79692 6856 S 87,7 0,7 13:50.11 beam.smp 
 8435 <hidden> 20 0 466616 11900 4628 S 25,9 0,1 0:01.04 rbtmqsrv 
 8444 <hidden> 20 0 376648 12808 5364 S 24,3 0,1 0:00.98 rbtmqclt

Now lets try to kill the “beam.smp”:

$ sudo kill -9 1221sudo kill -9 1221

test finishes with error:

$ ./run.sh $ ./run.sh ~/projects/endurox-benchmark-suite/tests/rabbitmq ~/projects/endurox-benchmark-suite/tests/rabbitmqStarting server process...panic: 
runtime error: index out of range
goroutine 1 [running]:exbench.Ndrx_bench_verify_buffer(0xc42000e030, 0x0, 0x0, 0x0, 0x20, 0xfe, 0x6282d9, 0xe, 0x0) /home/<hidden>/projects/endurox-benchmark-suite/src/exbench/testutil.go:85 +0x35dexbench.Ndrx_bench_clmain(0xc42000e030, 0x1, 0xc42005fea8, 0x1d) /home/<hidden>/projects/endurox-benchmark-suite/src/exbench/testutil.go:195 +0x21cmain.runbench(0x0) 
/home/<hidden>/projects/endurox-benchmark-suite/src/rbtmqclt/rbtmqclt.go:85 +0x320main.main() /home/<hidden>/projects/endurox-benchmark-suite/src/rbtmqclt/rbtmqclt.go:140 +0xd7rbtmqclt -num 40000 failed 
Test exiting with: 2

Thus we see that for RabbitMQ the application server processes are critical for operations, if any thing happens, the real-time IPC traffic is broken.

High Availability tests – multiple consumers

The typical  case for high availability processing is scenario where multiple consumers (server processes) are waiting for the message. And if any thing happens to one consumer process, the whole system is not destroyed, but maybe one transaction is lost. To test this scenario, the Enduor/X Benchmark suite will be adjusted to allow the retries of the messages (we will allow number of retries for the calls). So we will simulate typical HA test case, when one of the server processes dies and the other takes over. Visually this looks like

exsuite (1)

HA Test scenario with multiple consumers processes

As for Enduro/X  the configuration will be changed like this in “ndrxconfig.xml”:

 <server name="exsrv">
 <min>2</min>
 <max>2</max>
 <srvid>2100</srvid>
 <reloadonchange>y</reloadonchange>
 <sysopt>-e ${NDRX_APPHOME}/log/exsrv.log -r</sysopt>
 <cctag>1</cctag>
 </server>

The min/max is set to 2 meaning that two copies of the “exsrv” is booted. They automatically operate in load balanced mode (consuming the same services which they advertise)

For RabbitMQ test, we update the test script with two server startup (see “ldbalrun.sh”):

echo "Starting server proceses... 1"
rbtmqsrv &
SV1_PID=$!

echo "Starting server proceses... 2"
rbtmqsrv &
SV2_PID=$!

sleep 1

if ! kill -0 $SV1_PID > /dev/null 2>&1; then
 echo "RabbitMQ server 1 not started! Is RabbitMQ booted?" >&2
 go_out 1 
fi

if ! kill -0 $SV2_PID > /dev/null 2>&1; then
 echo "RabbitMQ server 2 not started! Is RabbitMQ booted?" >&2
 go_out 2 
fi

When performed the kill for one of the “rbtmqsrv”, the test continued with no problem. Thus RabbitMQ server processes can be load balanced with high availability property.

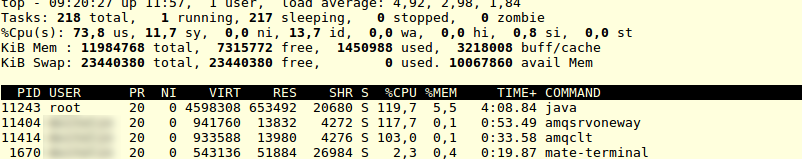
Now lets test the Enduro/X.

Two servers are booted:

Selection_139

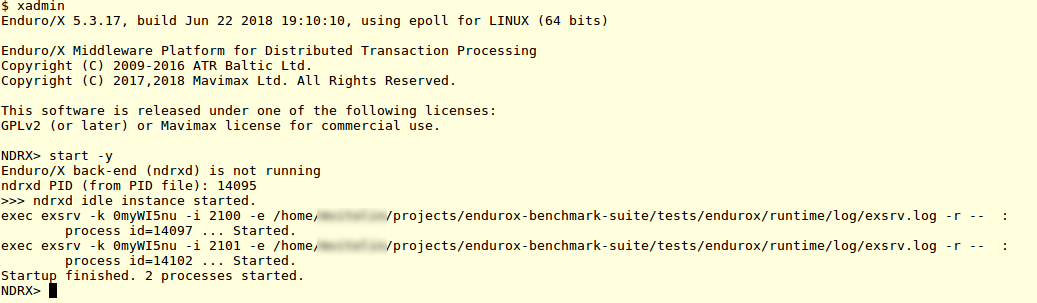
Enduro/X App server boot

Server executable statues:

Selection_140.png

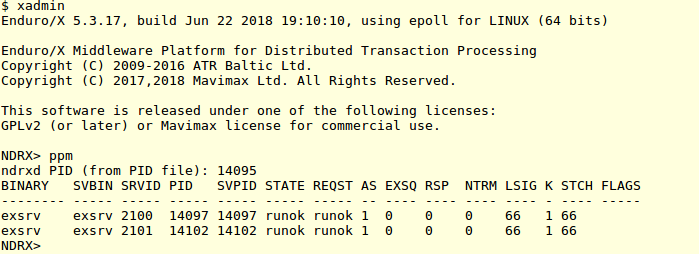
Enduro/X Process statuses at the start of the test

two processes are up and running with “66” sanity step from last status change. Now lets start the test, and kill one of the programs. The status change step shall be reset, and lets see what will happen with actual test (note the version seen in pictures here are actual staging 5.4 beta version). So after the kill, Enduor/X will reboot the missing process, thus we git following chronological picture of the process statues:

Selection_143

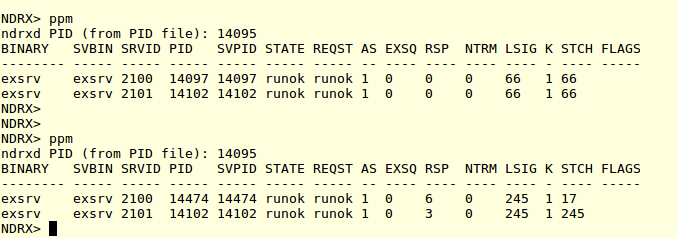
Enduro/X process statuses after the kill of one of the server processes

As we see the PID 14097 was killed and 14474 now we get in place. The test continues and there was no interruption for the client process running the benchmark (except the possible retry). By doing more “kill” to server processes, author got in client logs:

N:NDRX:2:d5d3db3a:14802:7fe243e01880:000:20180623:135940867:tpcall.c:1016:_tpgetrply to EXSVC failed

Message, while the all process was stopped. This was due to kill was reaching one of the servers while the call was in progress. Thus the client go timeout after the configured NDRX_TOUT=90 seconds of waiting for answer. Then the retry did kick in and test continued.

Update 24/06/2016 – midsummer test 🙂

For the RPC test case to be more fair, the Auto-Ack was turned on for the RabbitMQ, thus avoid some IPC rountrip for Acking to the RabbitMQ server. The results are following (note the Enduro/X test case was re-run too, so there might be some deviation in the system performance too)

vs

RPC benchmark with RabbitMQ Auto-Ack server set.

So with test, the RabbitMQ performed little bit better, the initial performance was 3632 RPC calls per second.

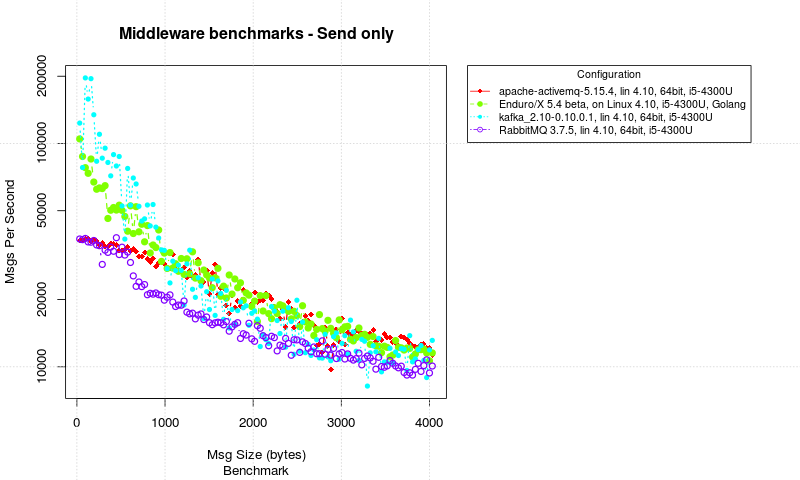
One Way call (send only, client -> server)

Another test was performed where send only messaging was done. The client streams messages to server. In this test the results are measured by server process by checking the moment when message size changes. Once changed, it divide number of messages received by time spent. Note that for each test one message is taken from next size group. Thus results is not 100% accurate, but generally the size increase is small, and message count is large, thus the measurements for compare should be fine. The results are following:

vs1w.png

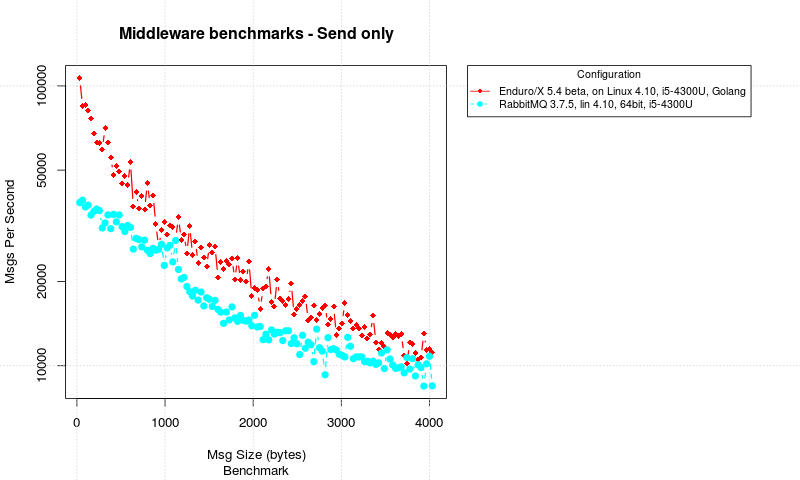
One way message delivery

In these test cases we see that Enduro/X starts about twice as fast as RabbitMQ. But numbers are good for both systems. But Enduro/X keeps RabbitMQ ahead with all message sizes. But really as surprise, RabbitMQ did hold good performance.

Conclusions

For the Go language endurox-go package did show the strength for the performance, where for small messages it was a magnitude ahead of the RabbitMQ. When message size increased the Enduro/X was several times after than RabbitMQ. This fact is critical for mission critical sub-millisecond systems, where the speed of might split the deal (for example Forex Exchange systems).

From high availability perspective regarding to the HA of the Application Server by it self, Enduro/X also here showed the strength in fact that the death of the App Server by it self, did not cause IPC traffic to be interrupted. While the death of the RabbitMQ server, did cause IPC to stop. For the systems which run for 24x7x365, this fact is critical. Also according to the Enduro/X tprecover process documentation, the “ndrxd” process is full recoverable, thus the business process will not see the any changes or interruptions.

The third test for load balanced/high availability server processes, the test confirms that for both systems like Enduro/X and RabbitMQ, the death of the load balanced server process does not cause the IPC problems and system can continue to live with other copy left from the multiple server processes.

For the Send only messages, both systems performed well, and by the surprise the performance numbers for RabbitMQ was good, but still Enduro/X did outperform the RabbitMQ.


Scaning to PDF with AFD

I have a HP Scanjet 5590 and to use AFD to make PDF, use following procedure:

To get scanner device name use:

$ scanimage -L
device `hp5590:libusb:002:018' is a HP 5590 Workgroup scanner

Scan the images with:

$ scanimage --device-name='hp5590:libusb:002:016' --source='ADF' -x 215 --resolution='200' -y 279 --batch

If you get errors like

$ scanimage --device-name='hp5590:libusb:002:016' --source='ADF' -x 216 --resolution='200' -y 279 --batch
Scanning -1 pages, incrementing by 1, numbering from 1
Scanning page 1
[hp5590] Top X (0) + pixels X (1700) exceedes max X 169


Try to manipulate with -x NNN attribute (I have changed to -x216 and now it works ok).

The output from the program is following:

$ scanimage --device-name='hp5590:libusb:002:016' --source='ADF' -x 215 --resolution='200' -y 279 --batch
Scanning -1 pages, incrementing by 1, numbering from 1
Scanning page 1
Scanned page 1. (scanner status = 5)
Scanning page 2
Scanned page 2. (scanner status = 5)
Scanning page 3
Scanned page 3. (scanner status = 5)
Scanning page 4
Scanned page 4. (scanner status = 5)
Scanning page 5
Scanned page 5. (scanner status = 5)
Scanning page 6
Scanned page 6. (scanner status = 5)
Scanning page 7
Scanned page 7. (scanner status = 5)
Scanning page 8
Scanned page 8. (scanner status = 5)
Scanning page 9
Scanned page 9. (scanner status = 5)
Scanning page 10
Scanned page 10. (scanner status = 5)
Scanning page 11
Scanned page 11. (scanner status = 5)
Scanning page 12
scanimage: sane_start: Document feeder out of documents


The result files:

$ ls *.pnm
out1.pnm out2.pnm out3.pnm out4.pnm out5.pnm out6.pnm out7.pnm out8.pnm out9.pnm out10.pnm out11.pnm

To join them properly in page order to PDF, you have to rename out1.pnm to “out01.pnm”, etc..


Then use “gm”

$ gm convert *.pnm output.pdf

To get the final PDF.